4 Tools To Debug Cumulative Layout Shift On Your Website
Browser
22/07/2021
Let me guess, you've analysed your website's performance and you received a bad score for Cumulative Layout Shift (CLS). This means that during the initial page load, 1 or more HTML elements have visibly moved around more than the tolerated amount.
If you wish to read more about CLS and how it's calculated, I recommend this article. For now, let me show you a few tools 🛠 you can use to identify the culprit(s)!
The suggested tools are only available in a Chromium-based browser.
Lighthouse
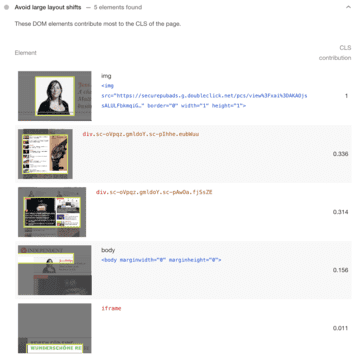
To start off, Lighthouse gives some great pointers as to which elements are causing trouble. In your browser, open DevTools. Then select the Lighthouse tab and generate a report with Performance selected.
Once done, under Diagnostics, there should be a dropdown called Avoid large layout shifts that lays out (pun intended 😆) the issues.

I recommend using this over a third-party tool like GTmetrix solely for the reason that you can test your localhost as you try to improve your CLS score.
Visual feedback
Another neat way to debug CLS is through visual feedback 👀. You've got 2 options: either see it as it's happening or get a historical view of it.
Live
In DevTools, click on the 3 dots in the top right corner. Go to More tools > Rendering and then select the Layout Shift Regions option in the bottom window.

Refresh your page and see the magic 💁♂️ happen.
History
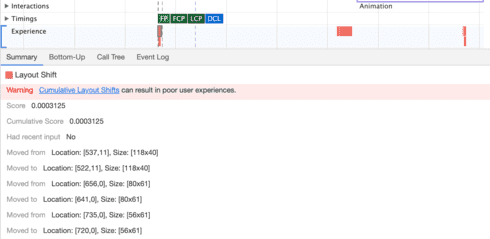
In the Performance tab, you'll first need to record the performance of the page load. Click on the round grey circle ⃝ in the top left corner, refresh the page and then press Stop.
You end up seeing a bunch of strips and I want you to pay attention to the one name Experience.

Click on a red block, which represents a layout shift that happened.
You should then see more details about the shift in the Summary window below. If you hover over the Location coordinates, you will see red overlays appear on your site.
Layout Instability API
For a detailed examination 🧐 of the shifted elements, I recommend using the Layout Instability API. The easiest way to do so is through the Web Vitals extension. After you've installed it, enable logging under Options > Console Logging.
Next, open your browser's console and refresh the page. You should then see something similar to below. Look out for the word CLS.

Dig a bit deeper in the log tree and you will come across the following properties of the element:
"previousRect": { "bottom": 46, "height": 40, "left": 373, "right": 491, "top": 6, "width": 118, "x": 373, "y": 6,},"currentRect": { "bottom": 46, "height": 40, "left": 358, "right": 476, "top": 6, "width": 118, "x": 358, "y": 6,}Here are some things you should know about:
xandycorrespond to the x and y coordinates of the elements top-left corner.- Similarly,
top,left,bottomandrightuse the top-left corner as their point of origin. For instance,bottomis calculated by addingyandheight. - If
previousRectcontains only0, this means that the element has shifted into view. If that is the case forcurrentRect, the element has shifted out of view.
- Get Width And Height Of HTML Element Using JavaScript
- Automatically Refreshing Google Sheets Formulas